As the fourth Thursday of November draws near, it’s time to stop and reflect on the important things – like the best sales on Black Friday. While I never have participated in the early morning rush to beat the crowds to get the best deal, some interesting observations can be made from this annual event. What if we apply the approach to our portfolios, specifically growth and value stocks?
Whether it’s a new television or shares of a company, a good starting point in assessing the opportunity is the price. For the purposes of this analysis, we’ll assess the “price” of a stock as its price-to-book (PtB) ratio, which is a common metric in finance to assess how expensive/attractive a stock is. At the end of October 2019, growth stocks (represented by the Russell 1000 Growth Index) traded at a PtB of 8.07 while value stocks (using the Russell 1000 Value Index as a proxy) stood at a PtB of 2.04. It is common for growth to trade at a higher PtB than value, so don’t read too much into this…yet.
How does the current price compare to its history? Available data, that goes back about twenty-five years, shows that growth and value stocks have averaged PtBs of 5.08 and 2.06, respectively. Put another way, growth is 59% more pricey and value is 1% less expensive than their long-term averages. One percent isn’t a sale to fight crowds over, but no one is going to get up early for a nearly 60% mark up!
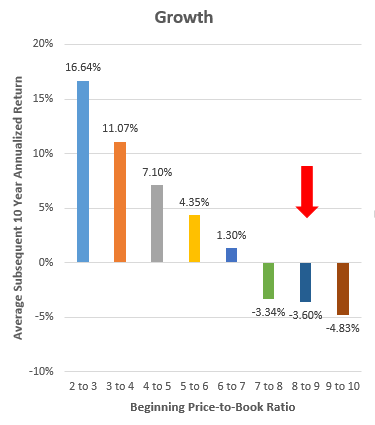
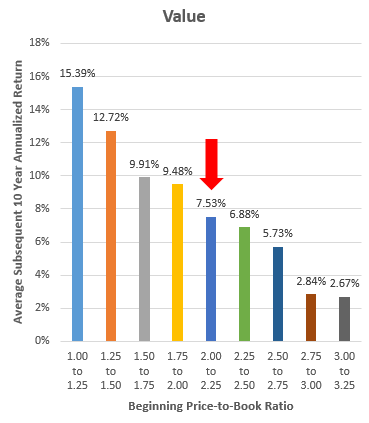
Another lens that can be used to view the current versus historical prices is to look at the distribution of price observations. A PtB of 8.00 to 9.00 has only occurred 7% of the time for growth stocks whereas a PtB of 2.00 to 2.25 was noted most frequently (38% of the time) with value shares.
Paying more than historical averages doesn’t just sting in that you’re not getting a deal; it can lead to serious buyer’s remorse. There is an inverse relationship between the price you pay and your subsequent investment experience. The graphs below compare different starting valuation levels with the subsequent ten year annualized returns.
The current valuations are consistent with ten year returns of -3.60% for growth and +7.53% for value. Indeed, the last time the PtB crossed 8.0 for growth stocks was June 30, 1999. From there, the annual return was -4.18% per year for the next decade. Value looks priced to deliver a more satisfying experience for the purchaser. On average, growth trades at 147% of value’s PtB. At the end of October, that metric was 296%.


Setting aside bargain hunting, there are reasons to be thankful. One reason is diversification. Research shows that value stocks perform better over long time periods. Owning a diversified portfolio that also includes growth stocks helps in the inevitable (and unforeseeable) times that value is out of favor.
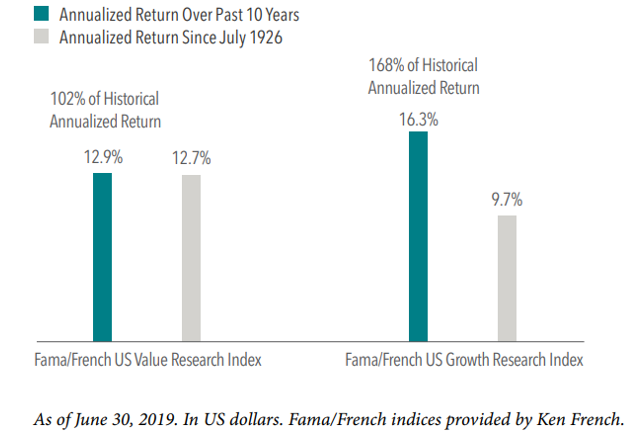
And while much has been made of how value has underperformed growth recently, some perspective is helpful. For the ten years ended June 30, 2019, value delivered 12.9% on average versus its long-term average of 12.7%. Over the same period, growth provided 16.3% against a historical backdrop of 9.7%.

Hypothetically, what would the next ten years look like for both sets of stocks to return to their long-term trends? Value would return 12.49% per year while growth would turn in 1.99%.
A second reason to give thanks is that we don’t engage in market timing. Valuations and mean reversion suggest that the returns through 2029 may favor value. This supports our strategic value tilt and has led us to make tactical shifts to best position our portfolios for the future. Making drastic moves to try to precisely time a growth to value shift is futile in our opinion. Consider the above example of June 30, 1999. With perfect hindsight, growth was expensive and had a bad next ten years. But the index kept rising and was up another 31% from that point through August 31, 2000.
A final reason for gratitude is that there are pockets of opportunity in a seemingly stretched market. The media reports every time the broad markets hit a new closing high. This has led many investors to ask if returns must then be lower in the future. There is no crystal ball, but there is data that suggests that maintaining exposure to more attractively priced areas of the market will provide stronger, more equity-like returns going forward.
And so, whether you enjoy the rush of bargain hunting on Black Friday or simply pausing to give thanks on Turkey Day, there are reasons to appreciate both in your portfolio. Happy Thanksgiving from Trust Company of the South!