“You’re a daisy if you do!” — Doc Holliday, Tombstone, 1993
We spend a fair amount of time on these pages beating up on traditional active management, the pursuit of beating benchmarks by timing the market or outsmarting it by picking benchmark-beating stocks. It’s also worth pointing out that our investment philosophy and methodology are technically active, not truly passive, so, to paraphrase Doc Holliday (at least the Val Kilmer version), “It appears our hypocrisy knows no bounds.”
Our approach is a lot different from traditional active management, though—we’re trying to harvest premiums from the market where they have existed for the last 100 years, in value stocks and small-cap stocks while taking measures to avoid truly risky stocks (mainly small, unprofitable ones), not dink and dunk around in the market and certainly not when we have no edge. To all those managers out there who can do that, and the evidence strongly shows there are few, well, you’re a daisy!
However, the market’s behavior during the last quarter, and really, over the last year, prompts us to pen a sincere defense of at least one facet of active management, and that’s diversification. Every investment manager who has ever sat through a single academic lecture on modern portfolio management understands that diversification is critical for long-term outperformance because it serves to limit volatility over time, which boosts compounding. Unfortunately for these same investment professionals, especially those who have embraced pure indexing as orthodoxy, it is not possible at this particular moment to be both purely passive and broadly diversified by buying the S&P 500, which, by the way, would have been an excellent investment in January 2023 or January 2024. Conundrum.
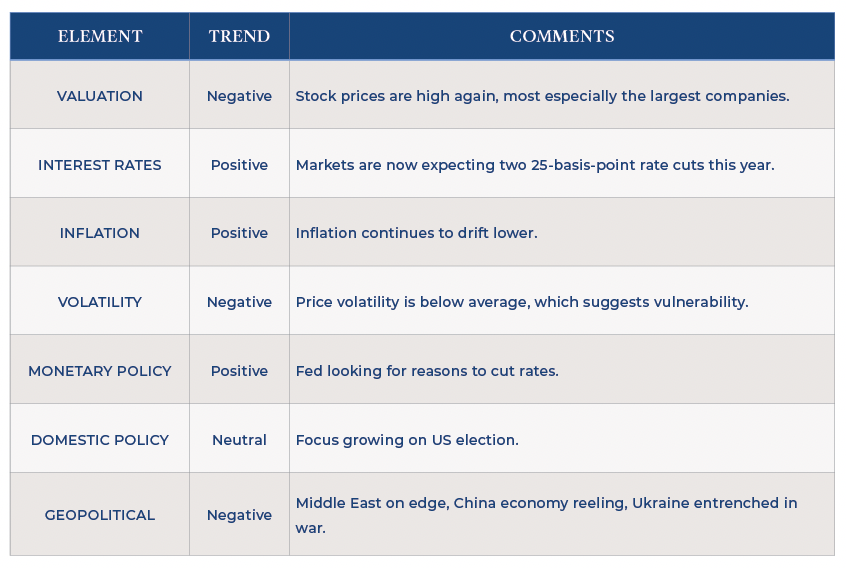
After a rocky start back in April, which feels like 1,000 years ago, major market indices were largely higher in the second quarter, completing a strong first half of 2024. The S&P 500 was up 4.3%for the quarter and has returned 15.3% for the first six months of the year. (The S&P 500 hit its all-time high again while I wrote this.) The U.S. economy is finally showing some signs of cooling, which is suppressing inflation and boosting the case for the Fed to begin cutting short-term interest rates later this year. The market is now pricing in two 25-basis-point cuts before the end of the year.
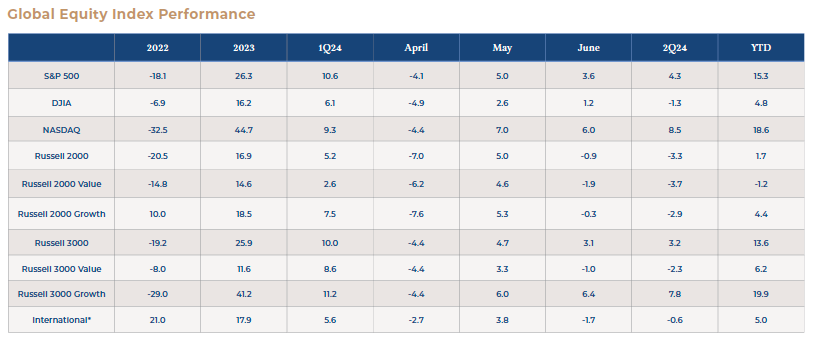
Source: Bloomberg, Trust Company of the South
The strong performance of technology shares, particularly those related to AI, has been unrelenting. Because of the investing public’s continued rewarding of AI and tech with higher and higher valuations, it is accurate to say that the S&P 500 is now a large-cap growth index. Of course, it is, when more than 27% of the entire index is in six companies (Microsoft, Apple, Nvidia, Amazon, Meta and two classes of Alphabet).
There aren’t many professional managers, active or otherwise, who would look clients in the eye and say, “Today, we’re putting about 30% of your assets into six names.” One would think there would be fewer who would follow up with, “Oh, and by the way, my risk officer suggested I tell you that these stocks also trade at an average multiple of forward earnings of 36, which is a 71% premium to the rest of the market, which is itself trading at a 23% premium to its historical average. This is what we are underwriting today.”
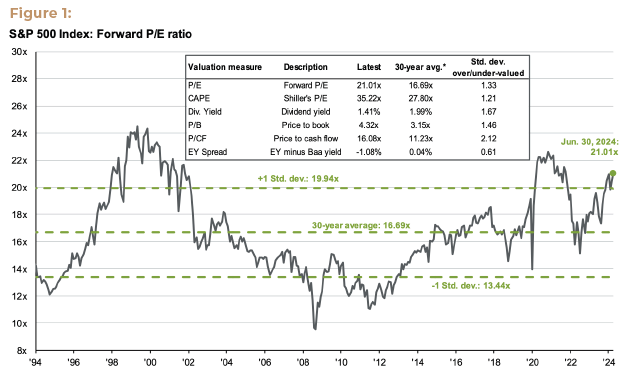
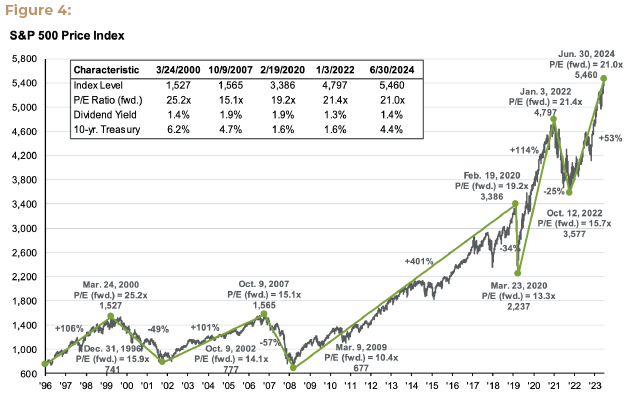
Source: Compustat, FactSet, Federal Reserve, Refinitiv Datastream, Standard & Poor’s, J.P. Morgan Asset Management. Dividend yield is calculated as consensus estimates of dividends for the next 12 months, divided by most recent price, as provided by Compustat. Forward price-to-earnings ratio is a bottom-up calculation based on IBES estimates and FactSet estimates since January 2022. Returns are cumulative and based on S&P 500 Index price movement only, and do not include the reinvestment of dividends. Past performance is not indicative of future returns.
Guide to the Markets – U.S. Data are as of June 30, 2024.
But again, we are in strange times. Advocates of pure indexing have a case, given their track record. So, who’s right? The pure indexers—the efficient market theorists who insist that markets cannot be beaten despite valuation and concentration? Or is it the diversifiers—the academics and risk management practitioners who have been taught for decades that diversification leads to better long-term risk-adjusted returns? Eggheads of the investing world, choose your champion.
Stock Pickers Market?
By some measures, this is precisely the kind of market environment in which stock pickers ought to excel. Correlation among stocks—the measure of to what extent stocks are moving together—is near record lows. That ought to make it easy for stock pickers to separate themselves from the pack, their prescience unobscured by correlation. Unfortunately, according to Morningstar, only 18.2% of actively managed funds that benchmark to the S&P 500 beat the index during the first half of the year. The Wall Street Journal reported that was lower than the first half of last year (19.2%) and also all of 2023 (19.8%). For the past decade, an annual average of just 27.1% of actively managed funds benchmarked to the S&P 500 outperformed, according to the Journal’s Jason Zweig.
Zweig noted that it could be the case that correlations actually were not as low as some might suggest. For example, using realized returns to measure correlations instead of implied volatility, correlations appear more or less normal. (This is the position taken by Dimensional Fund Advisors, our primary investment partner.)
Whatever one believes about correlation, it is certainly true that dispersion—a measure of how far the returns of individual stocks differ from the average—is high. However, that’s really just because of the extraordinary difference between the performance of the handful of giant tech stocks at the top of the market and all the others. The equal-weighted S&P 500 Index is up just 5.1% YTD through June and was down 2.6% for the quarter.
Why? Nvidia by itself accounts for almost one-third of the S&P 500’s total return in the first half, according to S&P Dow Jones Indices. More than half of the market’s total return came from five stocks (Nvidia, Microsoft, Amazon, Meta and Eli Lilly.) In the second quarter, 90% of the index’s return was in three stocks—Nvidia, Apple and Microsoft.
Stock pickers have lagged not because correlations are low but because if they didn’t own three mega-cap stocks that they’d ordinarily be embarrassed to own and own them in such size that it could attract the attention of regulators, then they’d have no chance to keep up!
What’s interesting is that investment titans such as Warren Buffett and Charlie Munger have, at times, poked fun at the diversification crowd, saying that they’d rather own a handful of great businesses, but Berkshire only has meaningful ownership of one of these companies (longtime holding Apple). They could have never justified the prices for the others.
Revenge of the diversifiers?
So, we know the market is top-heavy, and we know it has been for some time. But what does one do about this? The outlook for markets, or at least for corporate earnings growth, is far from gloom and doom. Almost a full third of the S&P 500 constituents are expecting earnings growth of more than 25% this year. By the end of the year, quarterly earnings growth for non-Magnificent Seven companies is expected to equal that of the Magnificent Seven. So, earnings growth is fairly plentiful at the moment. Why pay a huge premium for it? This set-up would suggest a healthy backdrop for stocks and for better risk-reward away from Big Tech.
On the other hand, there are some troubling aspects about recent market behavior. Normally, there is a regular and reliable relationship between the number of stocks that go up on any given day (advancers) and the extent to which the overall index rises. Makes sense, right? On days when lots of individual stocks rise, the market goes up. Well, recently, that relationship has broken down. Because of the extreme concentration at the top, there have been numerous days recently when most stocks in the S&P 500 have declined but the overall index went up. That’s unusual, and it might not be healthy. The relationship between single-name advancers and the overall index has become historically weak and resembles the relationship during the dot-com era.
The good news is that whether the market strength broadens beyond the small handful of names enjoying outsized success or if the market takes a breather, temporarily declining after this huge run-up, it seems like a reasonable position to take that value stocks and small-cap stocks would likely outperform. If the economy merely cools and does not recede, those categories would likely lead the market higher. Or, if we do experience a market downturn, the margin of safety maintained by having not followed the market’s valuation up would seem to serve investors well.
For the last decade, valuations have marched steadily higher around the world, but particularly so in the U.S. The price-to-book ratio on the S&P 500 increased from well below 3x a decade ago to almost 4.5x today. The valuation, in price-to-book terms, of the MSCI All Country World Index (ACWI) has gone from 2x to almost 3x. By comparison, the price-to-book on Trust Company’s equity portfolio has remained fairly constant throughout the period. Markets can change quickly. Prices paid for earnings have drifted higher for years. They won’t always.
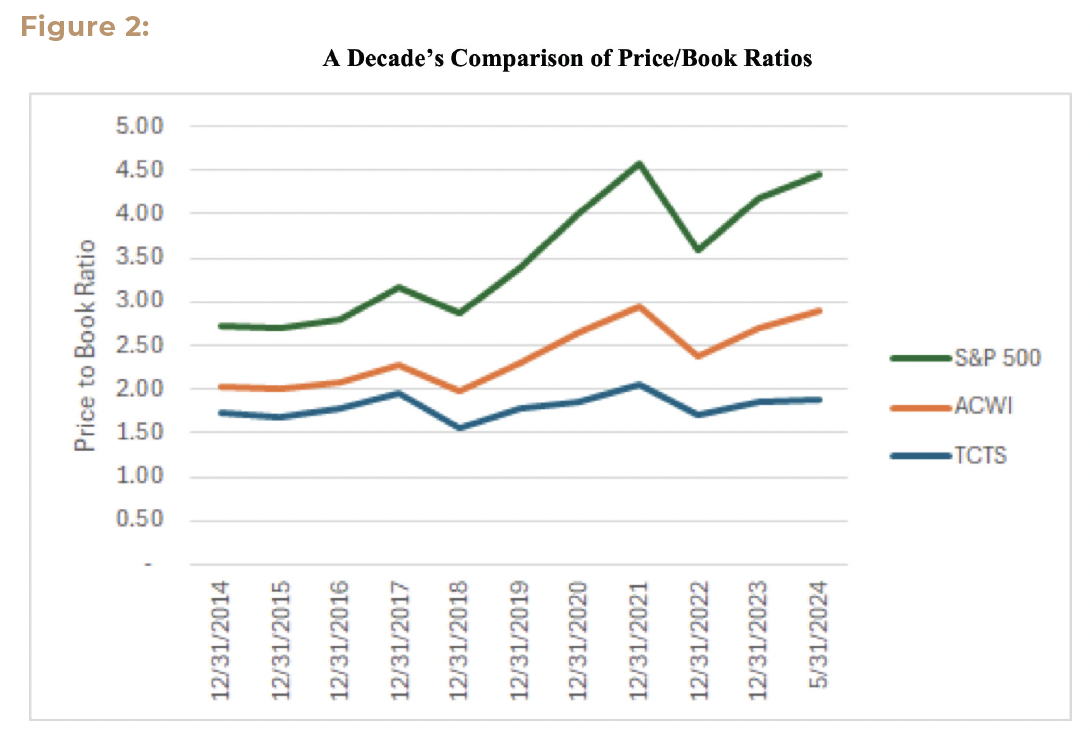
Source: Morningstar, Trust Company of the South
We’re not saying we are headed for a tech implosion and a bear market like we experienced back in the early 2000s, though with all the love the S&P 500 is getting right now, it’s probably worth pointing out that between the end of 1999 and 2009, the S&P 500 lost 9.1%, with an average annualized return of slightly more than negative 1%. The tech-oriented NASDAQ’s cumulative performance during the same period? Negative 39.8%.
What we are saying though, broadly speaking, is that value stocks have not been this inexpensive vs. growth stocks—and now the S&P 500 is a large-cap growth index—since the early 2000s in the aftermath of the tech collapse.
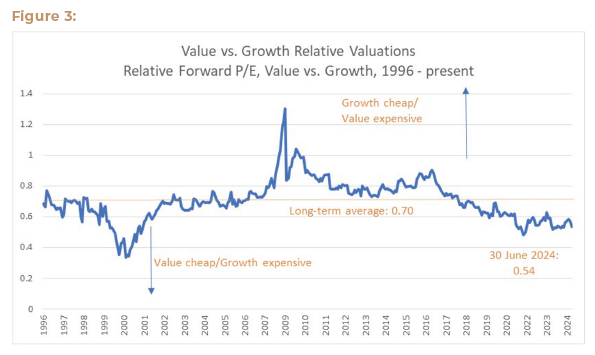
Source: Bloomberg, Trust Company of the South. Value represented by the Russell 1000 Value Index; Growth represented by the Russell 1000 Growth Index.
As it happens, during the dot-com bubble I was working in New York as a young analyst at Merrill Lynch when Rich Bernstein was the chief strategist there. He recently pointed out in an article for Bloomberg that back then, even though the tech bust ushered in broad underperformance, there were numerous asset classes that performed quite well, such as small caps, energy and emerging markets.
The recent outperformance of large-cap stocks vs. small-cap stocks has been unusual for this part of the cycle. Normally, small-cap performance vs. large-cap performance tends to follow credit spreads. Because smaller companies tend to have more leverage (both operating and financial), they tend to be more influenced by economic and profit cycles, Bernstein pointed out. Normally, large-cap stocks do better when credit spreads are widening and profits are deteriorating, as investors seek greater safety. That has not been happening for a couple of years, even as spreads remain tight and corporate profits are accelerating. Large-cap stocks keep carrying the day.
What does this mean going forward? Who knows? But we do like having a portfolio of stocks that is far more diversified and much less expensive and, therefore, perhaps less vulnerable to a pullback than the vaunted S&P 500.
Source: FactSet, FRB, Refinitiv Datastream, Robert Shiller, Standard & Poor’s, Thomson Reuters, J.P. Morgan Asset Management.
Price-to-earnings is price divided by consensus analyst estimates of earnings per share for the next 12 months as provided by IBES since February 1999 and by FactSet since January 2022. Current next 12-months consensus earnings estimates are $245. Average P/E and standard deviations are calculated using 30 years of history. Shiller’s P/E uses trailing 10-years of inflation-adjusted earnings as reported by companies. Dividend yield is calculated as the next 12-months consensus dividend divided by most recent price. Price-to-book ratio is the price divided by book value per share. Price-to-cash flow is price divided by NTM cash flow. EY minus Baa yield is the forward earnings yield (consensus analyst estimates of EPS over the next 12 months divided by price) minus the Moody’s Baa seasoned corporate bond yield. Std. dev. over-/under-valued is calculated using the average and standard deviation over 30 years for each measure. *Averages and standard deviations for dividend yield and P/CF are since November 1995 due to data availability.
Guide to the Markets – U.S. Data are as of June 30, 2024.
“Eventus stultorum magister.” (Fools have to learn by experience.) — Johnny Ringo, Tombstone, 1993
So, if we have to choose between the virtues of diversification and the virtues of passive investing, we would choose diversification. The secret source of indexing’s success is that investors frequently swap their own propensity to make bad decisions for the discipline of infrequent action and the collective wisdom of the crowds. The success of indexing comes largely from those two factors, but all it means is that it has helped lots of people avoid their own worst instincts; it’s not perfect. Layering on the additional discipline of diversification, and, perhaps more importantly, rebalancing from time to time, is far from subscribing to traditional active management and, moreover, is a fundamental component to long-term success in a global market.
Click here to download the PDF.
For more information, please reach out to:
Burke Koonce III
Investment Strategist
bkoonce@trustcompanyofthesouth.com
Daniel L. Tolomay, CFA
Chief Investment Officer
dtolomay@trustcompanyofthesouth.com
This communication is for informational purposes only and should not be used for any other purpose, as it does not constitute a recommendation or solicitation of the purchase or sale of any security or of any investment services. Some information referenced in this memo is generated by independent, third parties that are believed but not guaranteed to be reliable. Opinions expressed herein are subject to change without notice. These materials are not intended to be tax or legal advice, and readers are encouraged to consult with their own legal, tax, and investment advisors before implementing any financial strategy.
